The Power of GIS for Geo-Transparency
The integration of Geographical Information Systems (GIS) into environmental restoration and conservation projects marks a transformative step towards achieving geo-transparency and data-driven insights. This revolution empowers projects ranging from forest carbon offsetting to reforestation and broader conservation initiatives, by providing a digital mapping platform for showcasing their impact through rich geospatial data and interactive maps. Our exploration into the best GIS and mapping tools is designed to highlight software that excels in promoting environmental sustainability and geo-transparency, essential for project documentation and stakeholder engagement.
- The Power of GIS for Geo-Transparency
- A Guide to Leveraging Mapping Tools for Transparency and Impact
- Why Is Mapping Environmental Projects Important?
- Overview of GIS and Mapping Tools
- 1. explorer.land: Mapping impact with data and storytelling
- 2. QGIS: Open-Source Environmental Data Analysis
- 3. ArcGIS StoryMaps: Storytelling Meets Geospatial Presentation
- 4. Restor: A map that links scientists, NGOs, and businesses and provides data
- 5. AmigoCloud-Collection: Streamlining Field Data Collection for Conservation
- Conclusion
A Guide to Leveraging Mapping Tools for Transparency and Impact
Targeted at individuals pivoting towards the environmental sector, eager to make a tangible difference through their daily work, this piece serves as an introductory guide to outlining the power of mapping tools. We highlight those features and benefits that help foster project transparency and trust. Showing impact through better information management and geospatial data is from our perspective, the key to inspiring investors and unlocking more capital for the environmental space.
Why Is Mapping Environmental Projects Important?
Human activities, as well as natural phenomena such as floods, fires, and outbreaks of pests and diseases, have led to significant changes in land use, often degrading entire landscapes with profound effects on ecosystem functions, biodiversity, and climate.
Restoration initiatives, such as reforestation and conservation efforts, hold the promise of mitigating these negative impacts by increasing biomass, improving water retention, and enhancing biodiversity. Using geographic information software tools to create, manage, and interpret environmental project data helps to illustrate the impact of environmental projects across both spatial and temporal dimensions. This includes interactive map-based presentations, satellite & drone imagery, and thematic environmental data that tell the story of a project’s impact.
To support this, we have carefully selected a range of GIS and mapping tools for use at different stages of developing environmental conservation projects. These tools are designed to assist with planning, implementation, scaling, and enhancing communication and fundraising efforts. This includes tools for specialized map-based presentations of projects for funders and corporate sponsors through customized maps. These maps highlight the specific contributions of funders to restoration activities, thereby facilitating a transparent understanding and appreciation of their impact.
Overview of GIS and Mapping Tools
The tools are categorized based on the specific tasks they perform, accompanied by a brief overview of their pros and cons.
1. explorer.land: Mapping impact with data and storytelling
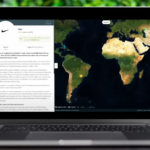
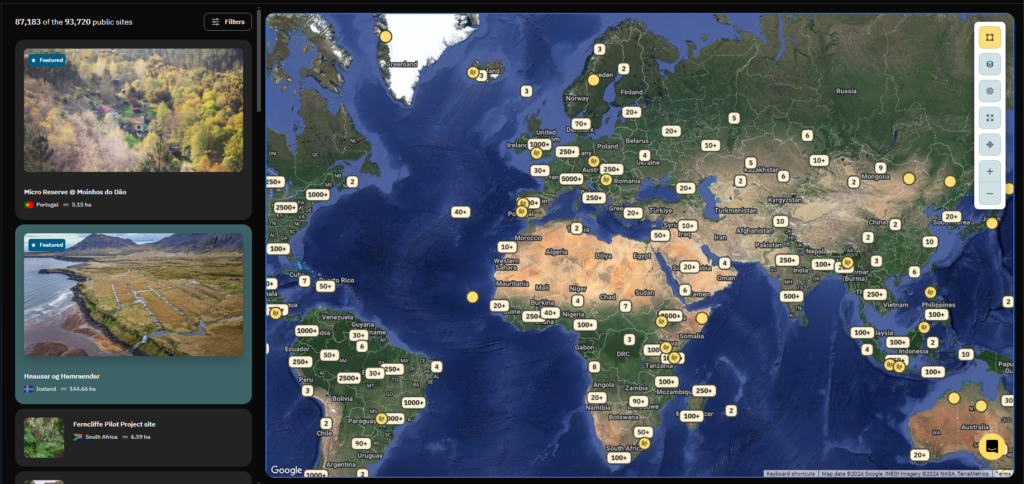
explorer.land is a vibrant platform that showcases nature-based projects and their inspiring stories in a visually stunning manner. It offers a unique, fully customizable experience, including integration options and an API for seamless data incorporation. This platform is designed to connect visitors and funders with projects and to immerse them in the journey of conservation and restoration efforts across the globe.
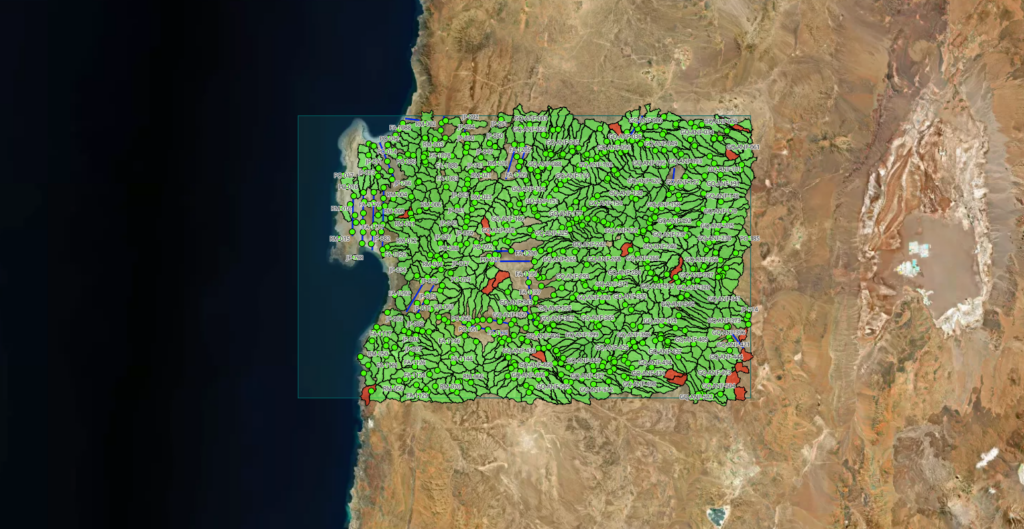
At the heart of explorer.land is a rich tapestry of project profiles, presented through high-resolution maps and robust data integration. The platform stands as a comprehensive tool for discovery, evaluation, and engagement with conservation projects worldwide. Users can navigate through geo-located presentations, utilizing thematic data layers for deeper insights, and exploring projects with a 3D discovery option. Its suite of features facilitates the creation of detailed profiles for projects and organizations, enabling stakeholders to build maps with geo-data import and synchronization and to track development through high-resolution imagery.
Communication is key on explorer.land, which offers geolocated news posts, options for social media sharing, and customizable call-to-action buttons. It supports the documentation of Sustainable Development Goals (SDGs), showcases forest products, and provides tools for effective team and user role management. The platform not only focuses on visual and data presentation but also on engagement, offering users opportunities to support projects financially or through the funding opportunities listing and filtering page. This fosters a global community of conservation enthusiasts, empowering individuals and organizations to contribute to environmental sustainability efforts.
Pros: ✓
- Branding & Whitelabeling: Project portfolios and single projects can be branded and whitelabeled.
- Accessibility: Self-service allowing also non-GIS experts to create maps within minutes.
- Interactive Maps: Impressive visual navigation allows users to present their organizations and project initiatives effectively.
- Detailed Project Profiles: Comprehensive information on goals, methodologies, and impact areas enriches user understanding.
- Data Integration: Supports a broad spectrum of content types including geospatial data, images, videos, and text, facilitating enriched presentations of projects.
- Landscape & Multi-stakeholder Views: Possibility to create various views, e. g. on a site, organization project portfolio, project profile, landscape views, and multistakeholder maps. Special views for sponsor maps, or micro sites are also supported.
- Transparency: A project story is documented via geo-located news posts, satellite time series, and thematic data layers increasing transparency and trust.
- Engagement Opportunities: Promotes various forms of participation, such as financial contributions and collaboration via call-to-action buttons, links, sponsor pages, and funding opportunities.
- Global Network: Encourages cross-cultural collaboration by connecting individuals, organizations, and projects worldwide.
- Custom Modules: Integration of custom modules to connect your own business logic to explorer.land and show custom KPIs, and dashboards.
Cons: ✕
- Internet Dependency: The need for internet access may limit accessibility in remote or underserved areas.
- Limited GIS analytics: Compared to desktop GIS applications such as QGIS there is a limitation to conducting comprehensive GIS analytics.
- License Fee: There is a free license available that includes most of the important features. Power users who want to unlock valuable additional features and modules can upgrade to a paid plan.
More information: home.explorer.land
2. QGIS: Open-Source Environmental Data Analysis
QGIS is a free and comprehensive GIS (Geographic Information System) software that supports various remote sensing tasks. It is well-suited for land-use classifications, constructing thematic maps, and performing detailed analyses.

QGIS is an open-source GIS (Geographic Information System) software that supports a wide variety of vector, raster, and database formats. It is compatible with numerous operating systems and offers extensive features for creating, editing, visualizing, analyzing, and publishing geospatial information. The development of QGIS is community-driven, providing a platform for users to contribute and interact with a global community of geospatial professionals.
Pros: ✓
- Versatility: QGIS is supported on multiple platforms, including Windows, macOS, Linux, BSD, and mobile, ensuring broad usability.
- Format Support: It can handle a diverse array of vector, raster, and database formats, offering adaptability to various geospatial data needs.
- Feature-Rich: The software provides comprehensive tools for creating, editing, visualizing, analyzing, and publishing geospatial data.
- Community Support and Open-Source Advantage: Thriving on active contributions from a global community, QGIS ensures continuous improvement and is freely available under the GNU General Public License for extensive customization.
- Cost-Effective: Being free, it presents an economical option for geospatial projects.
Cons: ✕
- Learning Curve: The complexity of the software may be overwhelming for beginners.
- Performance: It may exhibit limitations on older hardware or when handling large datasets.
- Support Variability: The quality of community assistance can vary.
- Lack of Web Platform Tool: Its desktop nature and the absence of a web version may pose challenges for some users.
- No Project Presentation: It does not function as a project presentation or communication tool.
More information: QGIS
3. ArcGIS StoryMaps: Storytelling Meets Geospatial Presentation
Presenting a linear story through scrolling, which combines storytelling with interactive thematic maps and the integration of multimedia content, offers the possibility to showcase different kinds of content including Nature-based Solutions.

ArcGIS StoryMaps is a web application designed for storytelling with a focus on maps. It allows users to combine text, multimedia, and interactive maps to create presentations. While it does have some issues with data filtering within stories, it integrates well with ArcGIS, making it possible to include customized, interactive stories that are shareable and have a visual appeal.
The integration with ArcGIS is a key feature, as it enables users to add detailed geographical data to their stories. This is useful for creating specific stories and maps for a project.
Pros: ✓
- Specific Stories: Users can create stories and maps specific to their project’s needs.
- Integration of Elements: The application supports text, multimedia, and interactive maps, which can add to a story’s detail.
- Management and Customization: It provides tools for managing and customizing stories.
- Optimized for Devices: The application works on both desktop and mobile.
- Web Optimization and Sharing: Features for web optimization and social media sharing are included, aiming to increase a story’s visibility.
- Integration with ArcGIS: The ability to integrate with ArcGIS and include geographical data is an important feature.
Cons: ✕
- Learning Required: There is a learning curve involved in using the platform, which might deter some users.
- Content Not Standardized: The lack of standardized content can lead to variability in the quality and presentation of stories.
- Limited Project Portfolio Presentation: The application does not have specific features for presenting a portfolio of projects.
- Limited Third-Party Integration: The ability to integrate third-party business logic is limited, which may restrict the platform’s use in certain cases.
- No Direct Data Filtering: The platform does not support direct data filtering within Story Maps, which could be inconvenient for users of large datasets.
More information: Story Maps
4. Restor: A map that links scientists, NGOs, and businesses and provides data
Restor is a platform that facilitates ecosystem restoration by integrating environmental KPIs and promoting collaboration across scientists, NGOs, and businesses. It offers mapping tools and data insights to support biodiversity and carbon sequestration efforts within the restoration community.
Restor is a platform aimed at supporting ecosystem restoration efforts as part of climate change mitigation strategies. It acts as a central point for connecting various stakeholders such as scientists, non-governmental organizations, businesses, and government entities to share knowledge and create partnerships. The platform offers insights into restoration sites by providing information on biodiversity, carbon sequestration, and more, promoting transparency and community involvement. Users can contribute by adding their sites and accessing data on different environmental aspects like biodiversity, carbon, and land use. Organizations can also map their environmental projects, share their impact, and collaborate with others on nature-related projects. Restor encourages user interaction to help find partners and projects focused on biodiversity conservation.
Additionally, Restor provides a list of over 60 financial support options, such as accelerators and grants, aimed at those involved in nature restoration. This aspect highlights Restor’s goal of building a large community dedicated to restoring nature by offering necessary resources and funding opportunities.
Pros: ✓
- Restoration Platform: Serves as a general hub for connecting various parties involved in ecosystem restoration, enabling worldwide cooperation.
- Partnership Opportunities: Links scientists, non-profits, businesses, government entities, and field workers, facilitating collaborations across different sectors.
- Project Support: Enhances the recognition and credibility of initiatives, aiding in the attraction of partners and resources.
- Access to Information: Offers entry to important restoration information, aiming for transparency.
- Global Effort: Collaborates with key organizations to support global ecosystem restoration efforts.
- Legal and Charitable Status: Functions in accordance with Swiss legislation and qualifies as a charitable organization similar to a US 501(c)(3), promoting reliability and integrity.
Cons: ✕
- Limited Customization: The platform does not support customization or data synchronization with other platforms or software, which restricts its integration capabilities.
- Reliance on Google Maps: It is dependent on the Google Maps framework, which may limit the performance and integration of third-party applications due to its restrictive nature.
- Lack of a Professional License Model: There is no professional-tier plan available that offers additional features beyond what is available in the free plan.
- Limited Branding Options: The platform offers minimal branding opportunities and does not support a white-labeled setup, restricting companies from branding the platform as their own.
- Absence of Customization Options: The platform does not permit customization or synchronization with other platforms or software, limiting its adaptability and integration potential.
- No Integration with Third-Party Custom Aerial Imagery: It does not provide the capability to incorporate and overlay third-party custom aerial imagery, which could improve the analysis and monitoring capabilities for restoration sites.
- Lack of 3D View Functionality: The platform does not offer a 3D view mode for projects, eliminating the possibility for immersive fly-in views.
More information: https://restor.eco/
5. AmigoCloud-Collection: Streamlining Field Data Collection for Conservation
Flexible tool for field data collection such as photos, geolocations, and data. Create your custom data collection form and run it on iOS and Android mobile apps.
The Amigo Cloud collection facilitates the digitization of field data collection, offering tools for capturing location data via mobile apps, even offline. It supports the creation of intuitive forms that can include a variety of data types, such as photos, videos, and signatures. The platform automates fieldwork through configurable notifications and automatic reports, enabling real-time monitoring and sharing of results through interactive maps and charts. For environmental conservation projects, this technology can be instrumental in gathering and analyzing data on ecosystems, wildlife, and pollution, enhancing the efficiency and accuracy of conservation efforts.
Pros: ✓
- iOS and Android: Data survey forms are available as mobile apps for iOS and Android.
- Offline Capability: Allows data collection in remote areas without internet access.
- Streamlined Data Collection: Optimizes field data collection workflows.
- Data Diversity: Supports various data types for detailed environmental analyses.
- Efficiency: Automates fieldwork processes, saving time and resources.
- Rapid Process Improvement: Dramatically reduces the time required for complex processes (e.g., from weeks to less than an hour).
- User-Friendly: Combines easy-to-use interface with powerful functionality, suitable for both beginners and experts.
Cons: ✕
- Learning Curve: New users may require time to fully leverage the use of the data collection app.
- Cost: AmigoCloud Collection comes at a cost of about 50US$ month per user, which might be a barrier for small organizations or individual users.
- Post-processing: For more extensive data postprocessing and analytics data have to be exported and imported to other data analytics software.
Learn more: AmigoCloud Collection
Conclusion
The pivotal role of Geographic Information Systems (GIS) and mapping tools in facilitating nature-based projects is undeniable. These technologies are instrumental in documenting environmental impacts, enhancing the transparency of projects, and promoting community involvement. For project developers, investors, or conservation enthusiasts, these tools provide indispensable resources to support and illustrate the effects of nature-centric initiatives.
In our discussion, we highlighted five key tools:
- explorer.land for showcasing project impacts through data and narratives;
- QGIS for open-source environmental data analysis;
- ArcGIS StoryMaps for combining storytelling with geospatial data;
- Restor for connecting scientists, NGOs, and businesses with relevant data; and
- AmigoCloud for optimizing field data collection.
Each tool offers unique advantages, catering to various needs within environmental conservation, including data analysis, project narration, global restoration efforts, and efficient field data gathering.
However, it is important to recognize the existence of many other specialized tools that also significantly contribute to the field. These tools are worth exploring for those looking to develop their own nature-based projects, seeking more transparency in their nature-based project investments, or needing to compile environmental impact insights for Corporate Social Responsibility (CSR) reports.
For further details on GIS and mapping tools, visiting the Nature Data Alliance or Nature Data Collective websites is highly recommended. These platforms can provide more comprehensive insights into the array of tools available to support your environmental conservation efforts.
Please subscribe to our newsletter and get in contact If you want to learn more about mapping and monitoring applications.